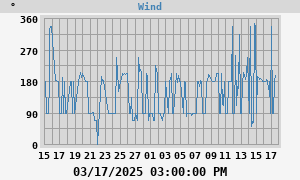
Wind
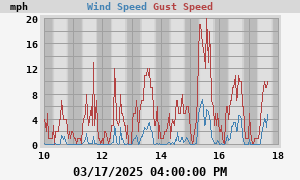
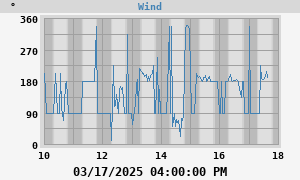
24h
max: 6 mph at 10:45:00 AM max gust: 17 mph at 10:21:19 AM
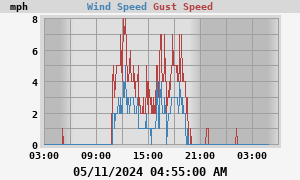
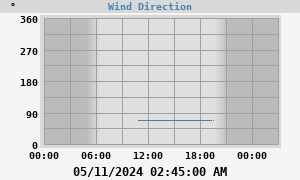
Last 7 days
max: 7 mph at 02:45:00 PM (Sunday) max gust: 17 mph at 10:21:19 AM (Monday)
Last 30 days
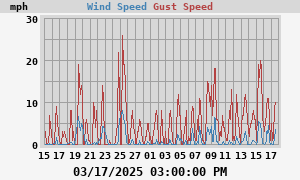
max: 12 mph at 02/10/2019 05:50:00 PM max gust: 22 mph at 02/10/2019 05:40:00 PM